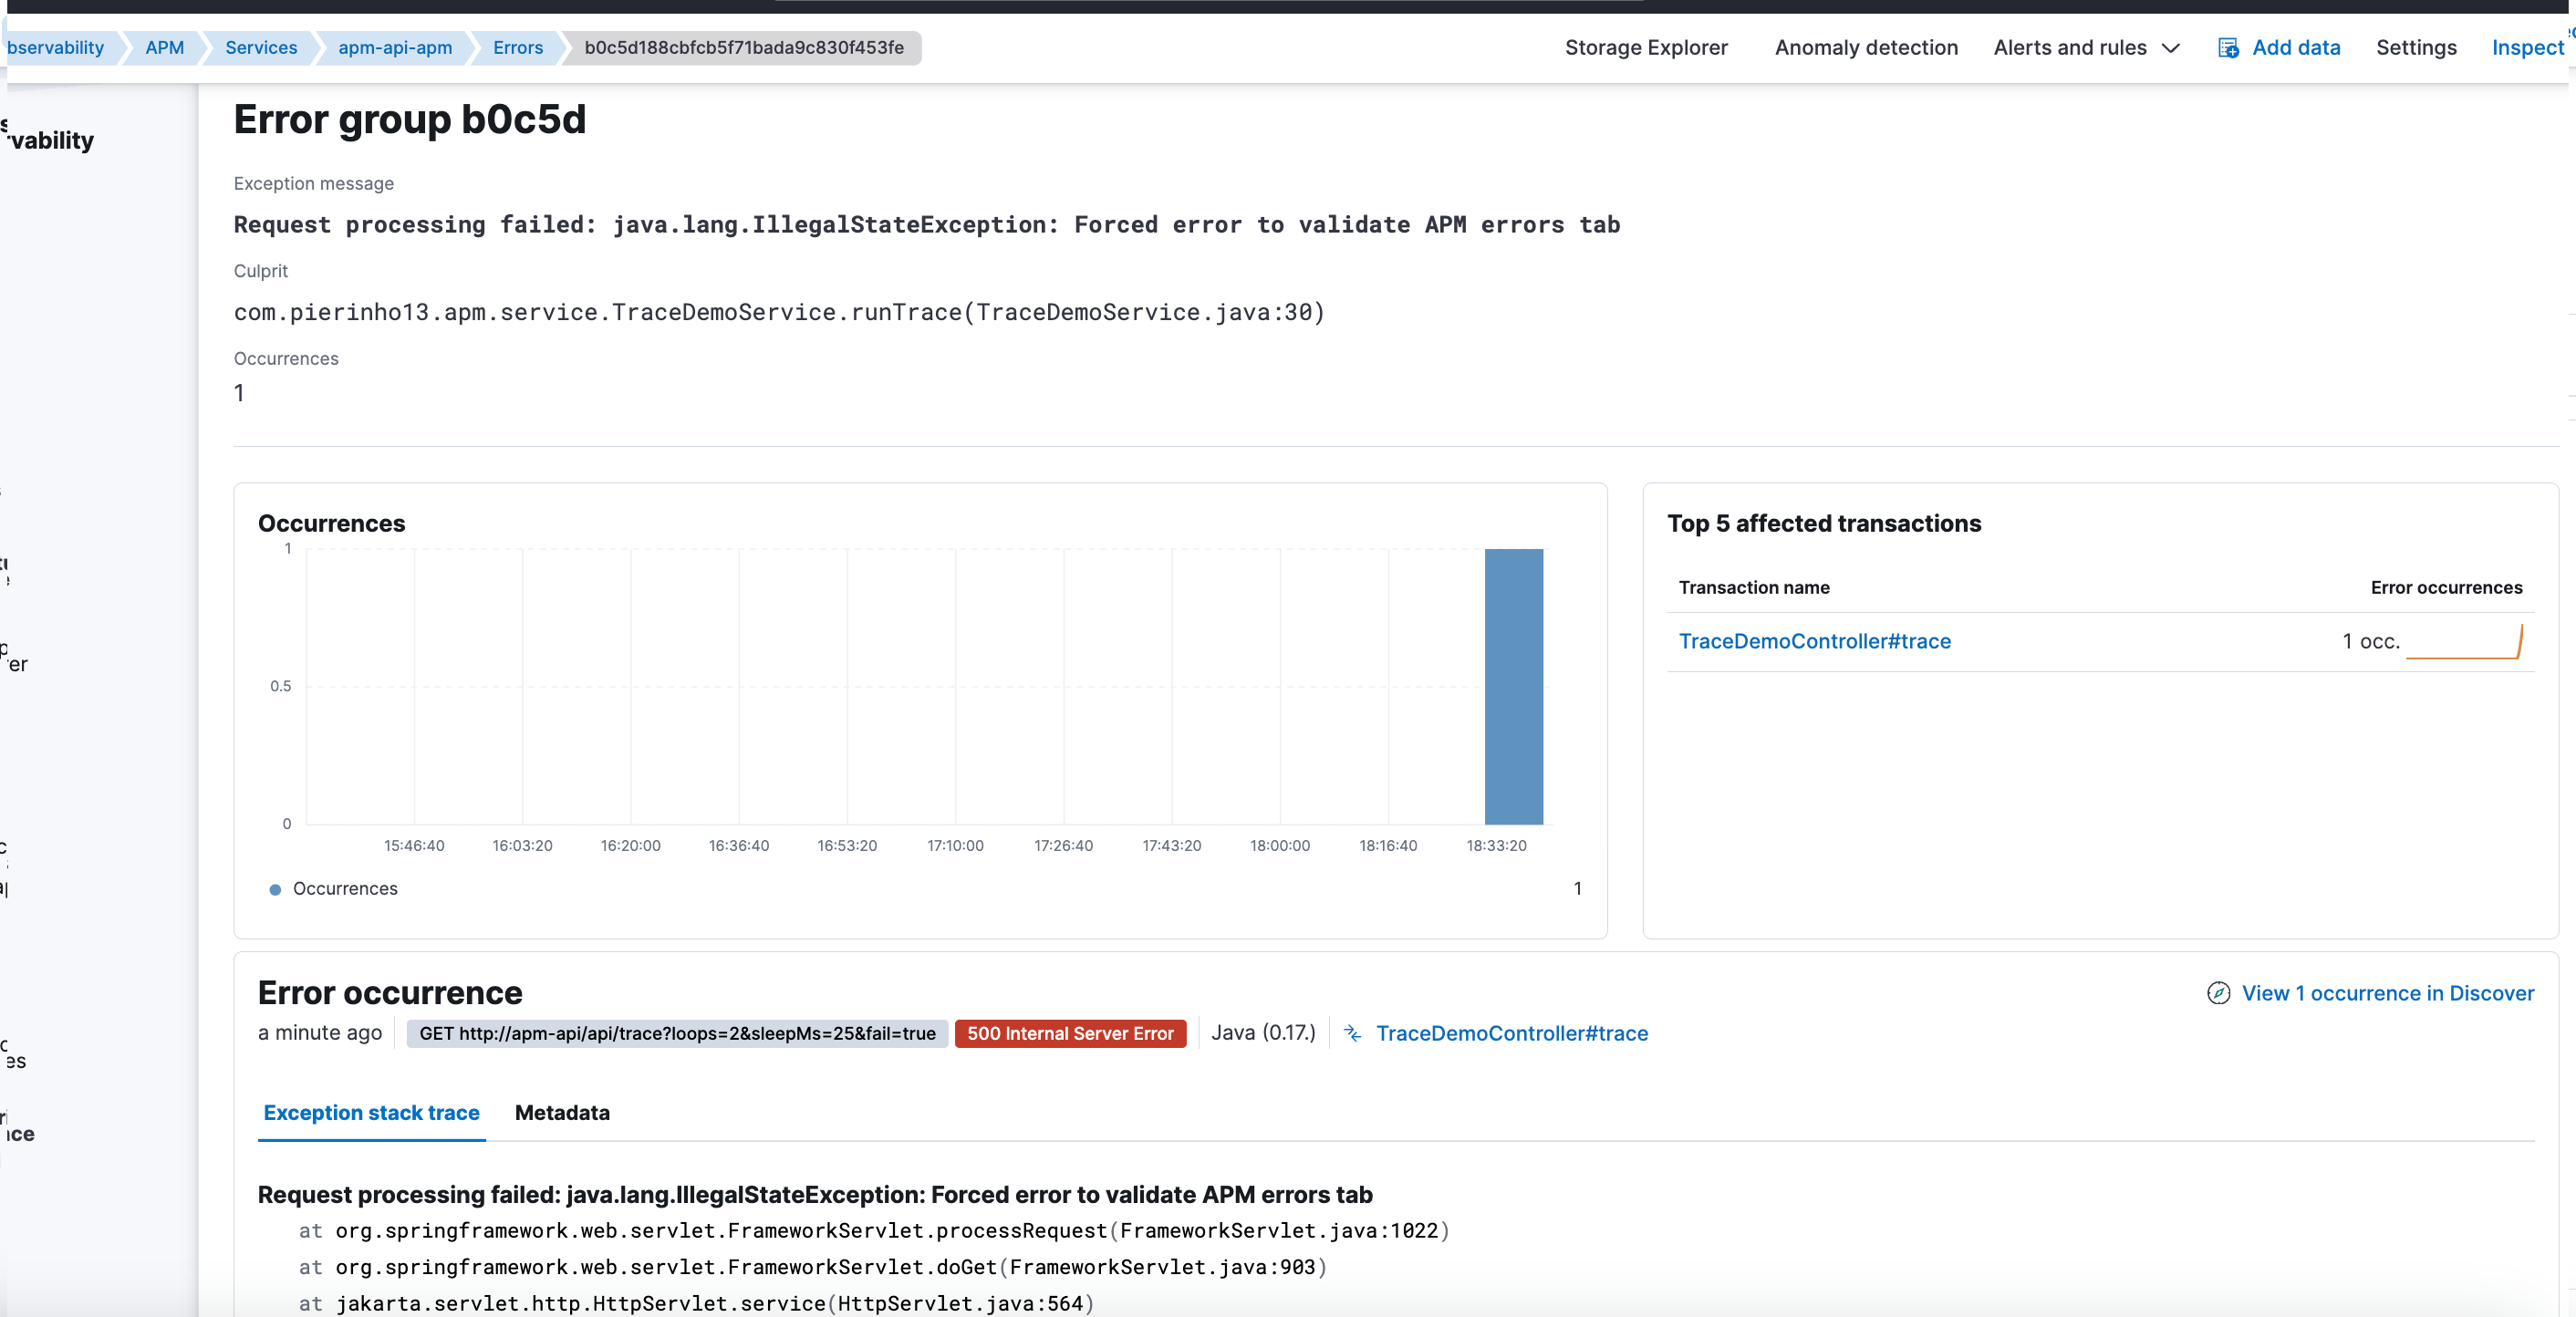
Elastic APM was working. Transactions were appearing. Service calls were visible with reasonable clarity.
And yet, there was something deeply frustrating: errors weren’t showing up.
The application had real exceptions, visible in the logs, but in the APM UI:
- No errors.
- No stacktraces.
- Traces looked “clean”.
The problem wasn’t obvious. And it wasn’t where I thought it was.
The context
I was integrating Elastic APM into a Java application running on Tomcat.
The basic integration was correct:
- The APM agent started without errors.
- APM showed services and transactions.
- Requests were traced correctly.
On the surface, APM worked. For diagnostics, it didn’t.
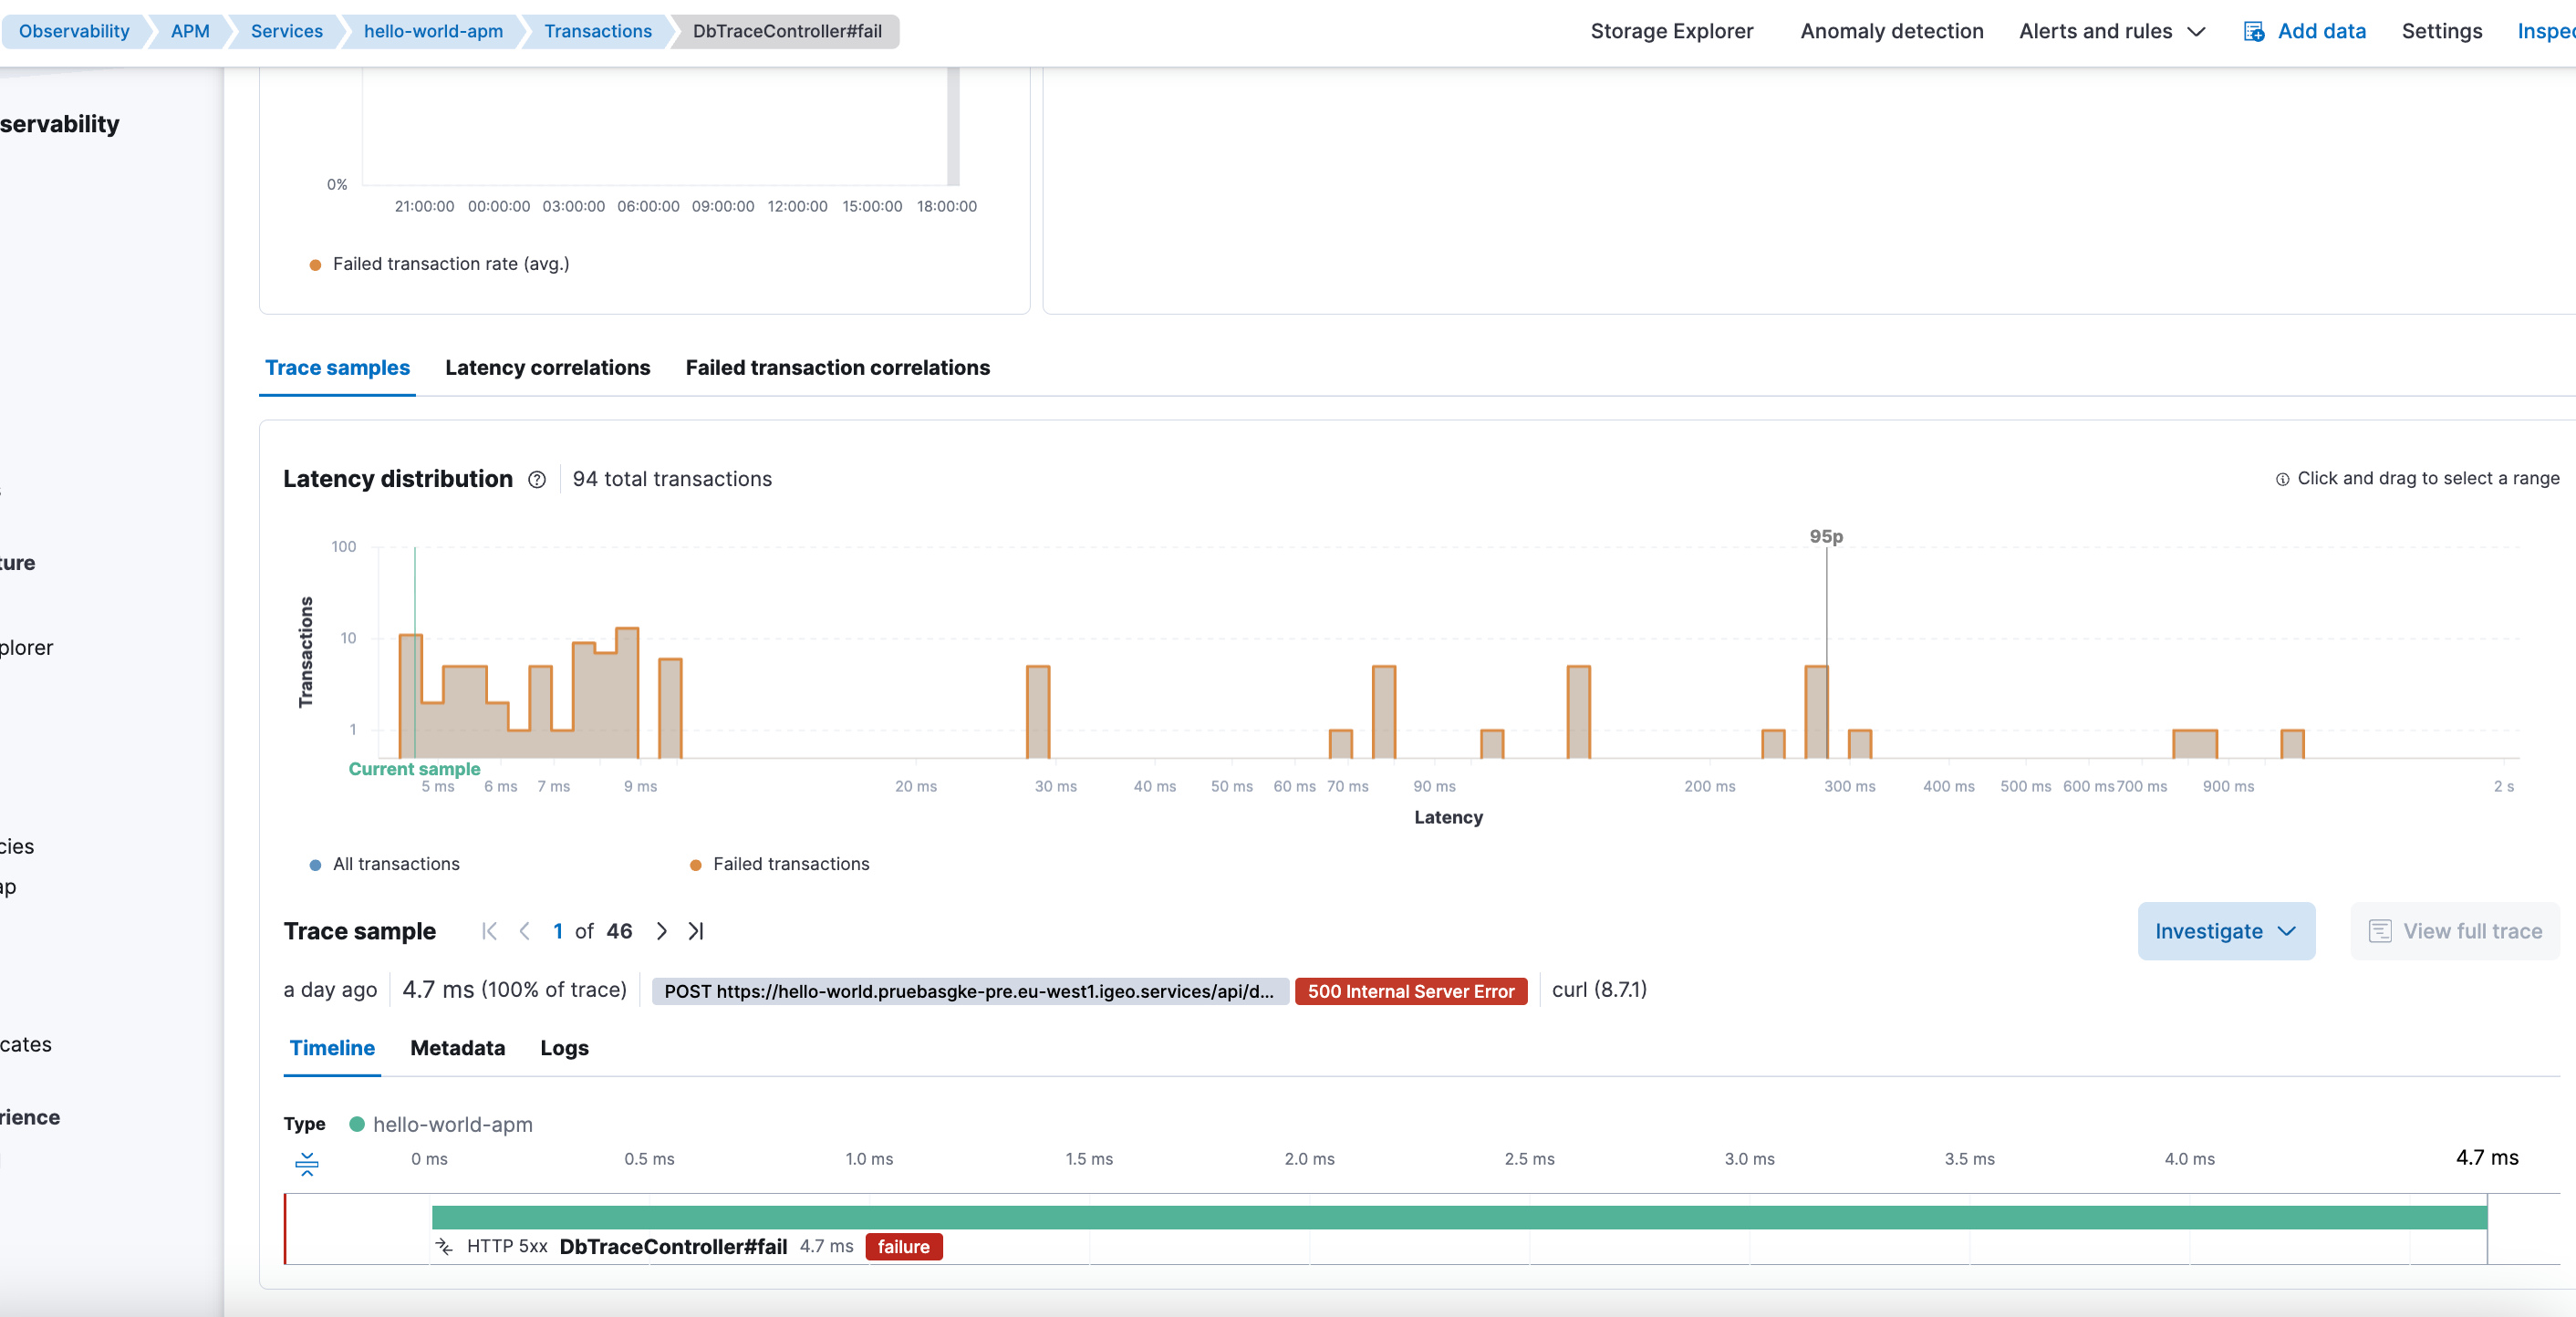
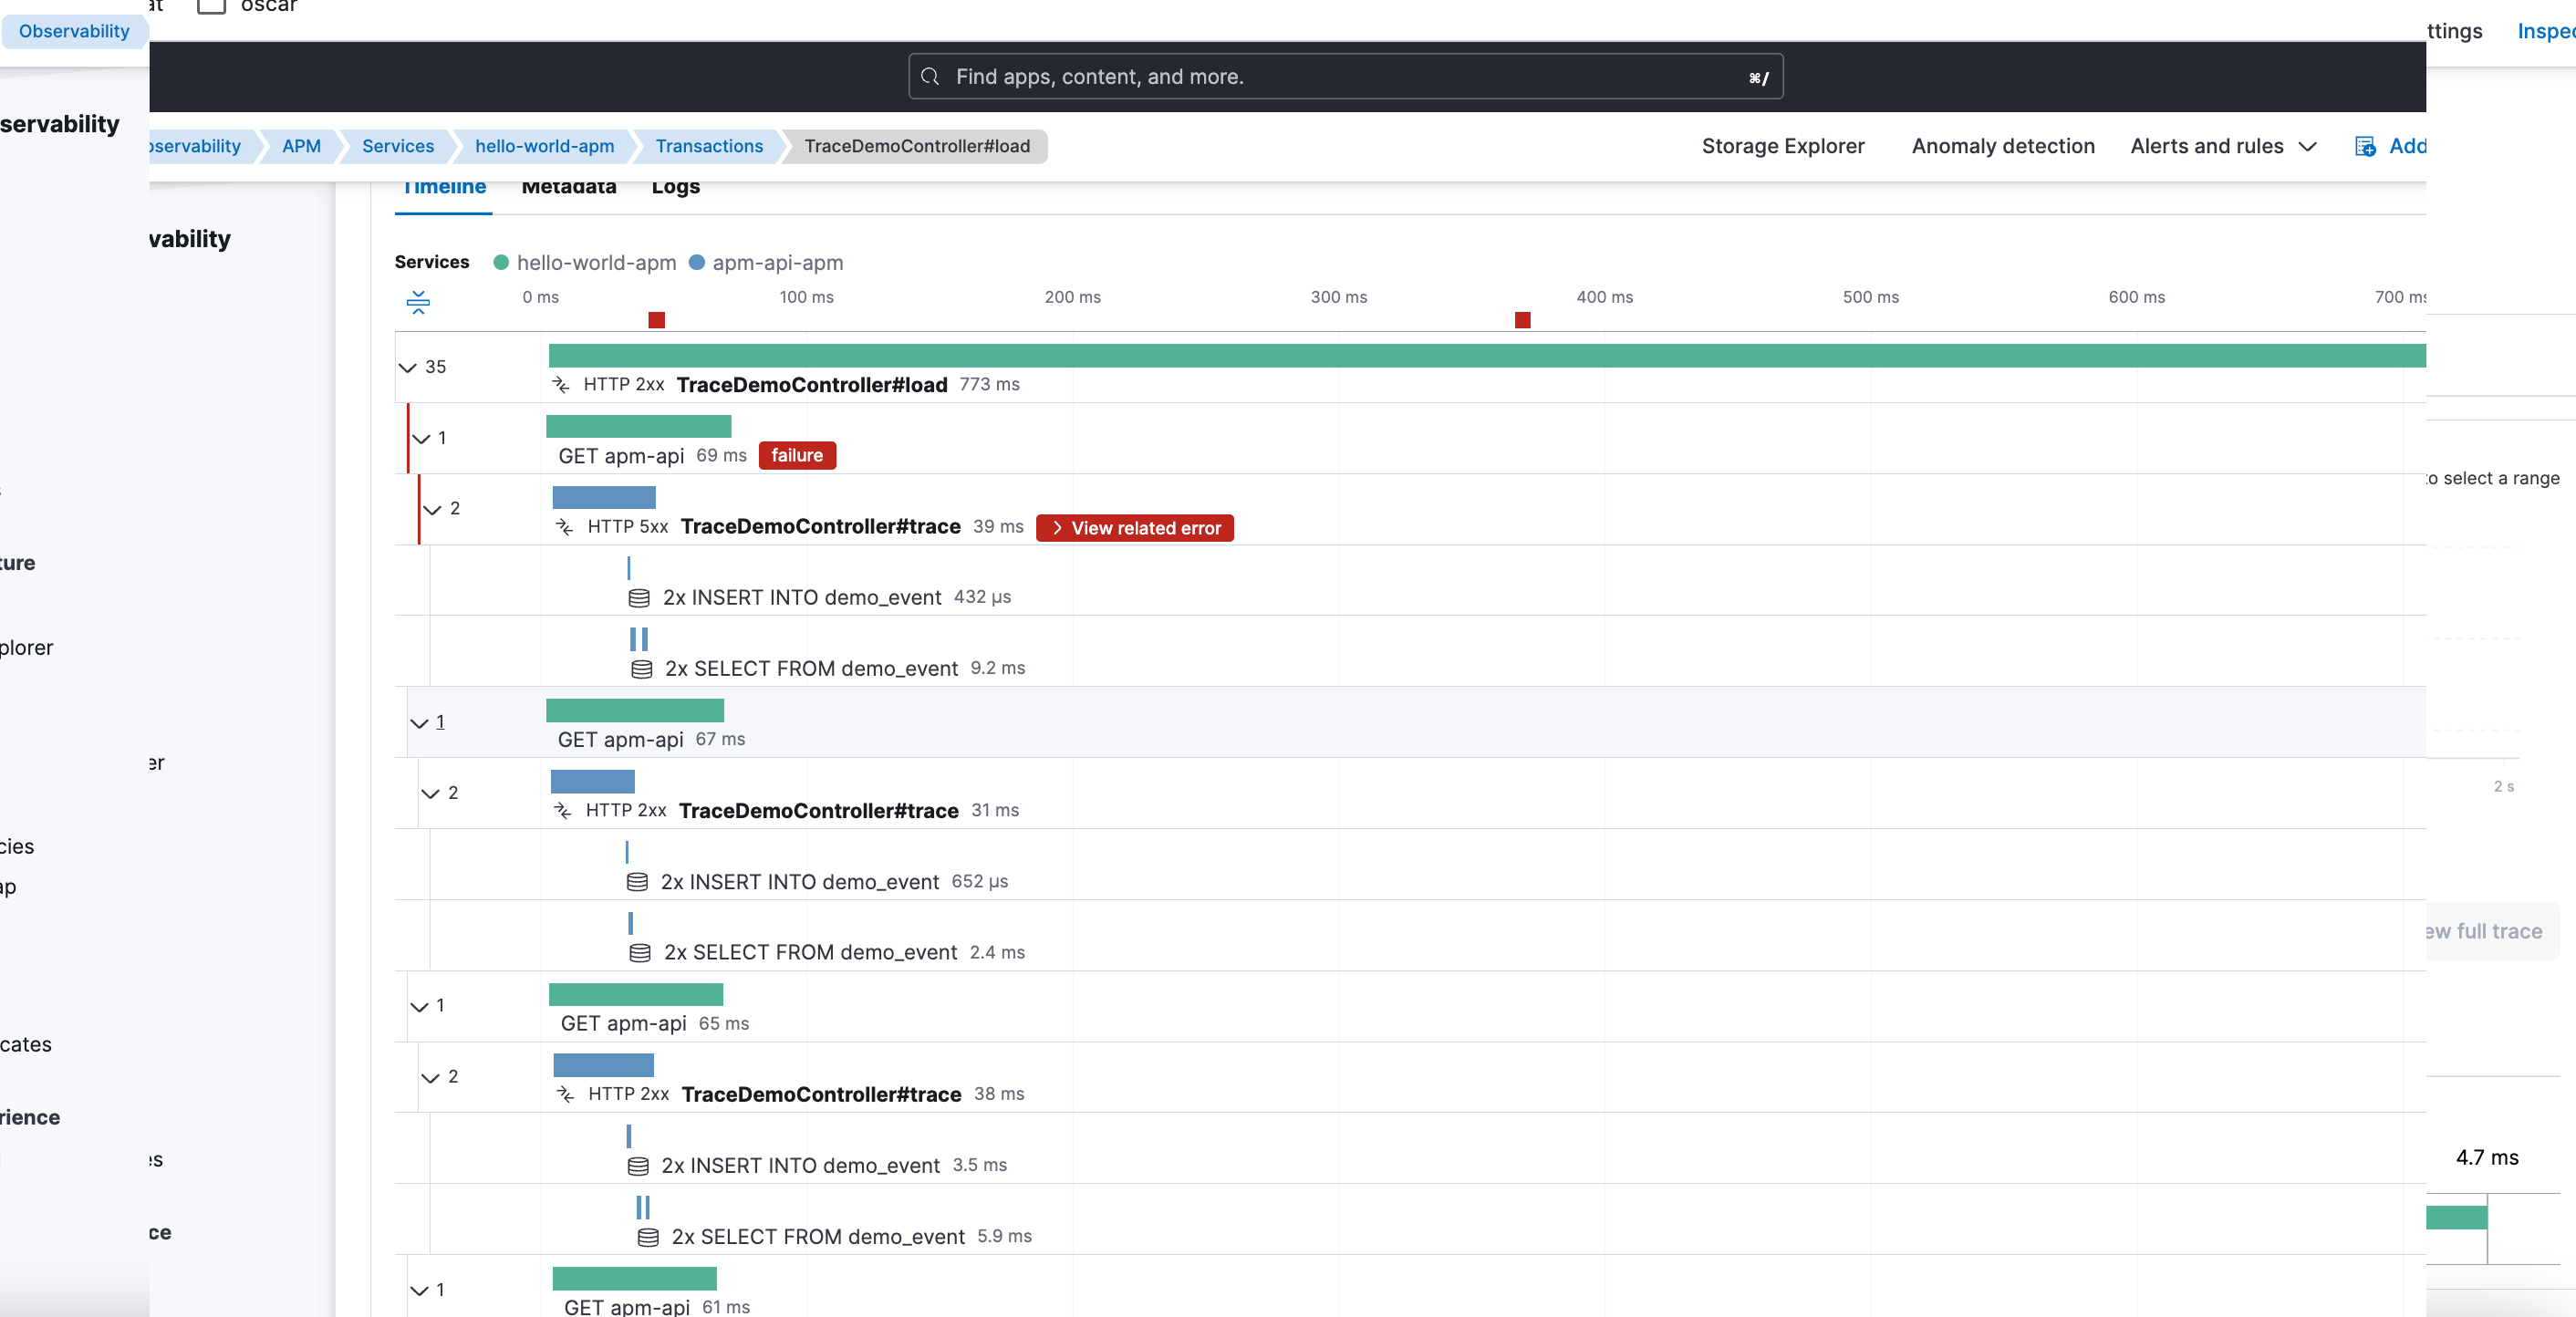
The real symptom: traces without error context
Traces showed:
- Durations.
- Calls.
- The overall flow of the request.
But it was missing the most important thing when something failed:
- No associated error.
- No stacktrace.
- No clear hint of the real reason for the failure.
This is especially deceptive because APM wasn’t empty. It was incomplete.
First instinct: add more instrumentation
My first reaction was to think the problem was insufficient detail in the traces.
I initially tried to force instrumentation with:
ELASTIC_APM_TRACE_METHODS=com.pierinho13.*#*
The result was immediate, but not useful long-term:
- Much more detail.
- Too many methods instrumented.
- A volume of spans hard to manage.
- Excessive noise for a real environment.
APM stopped being a diagnostic tool and became a data volcano.
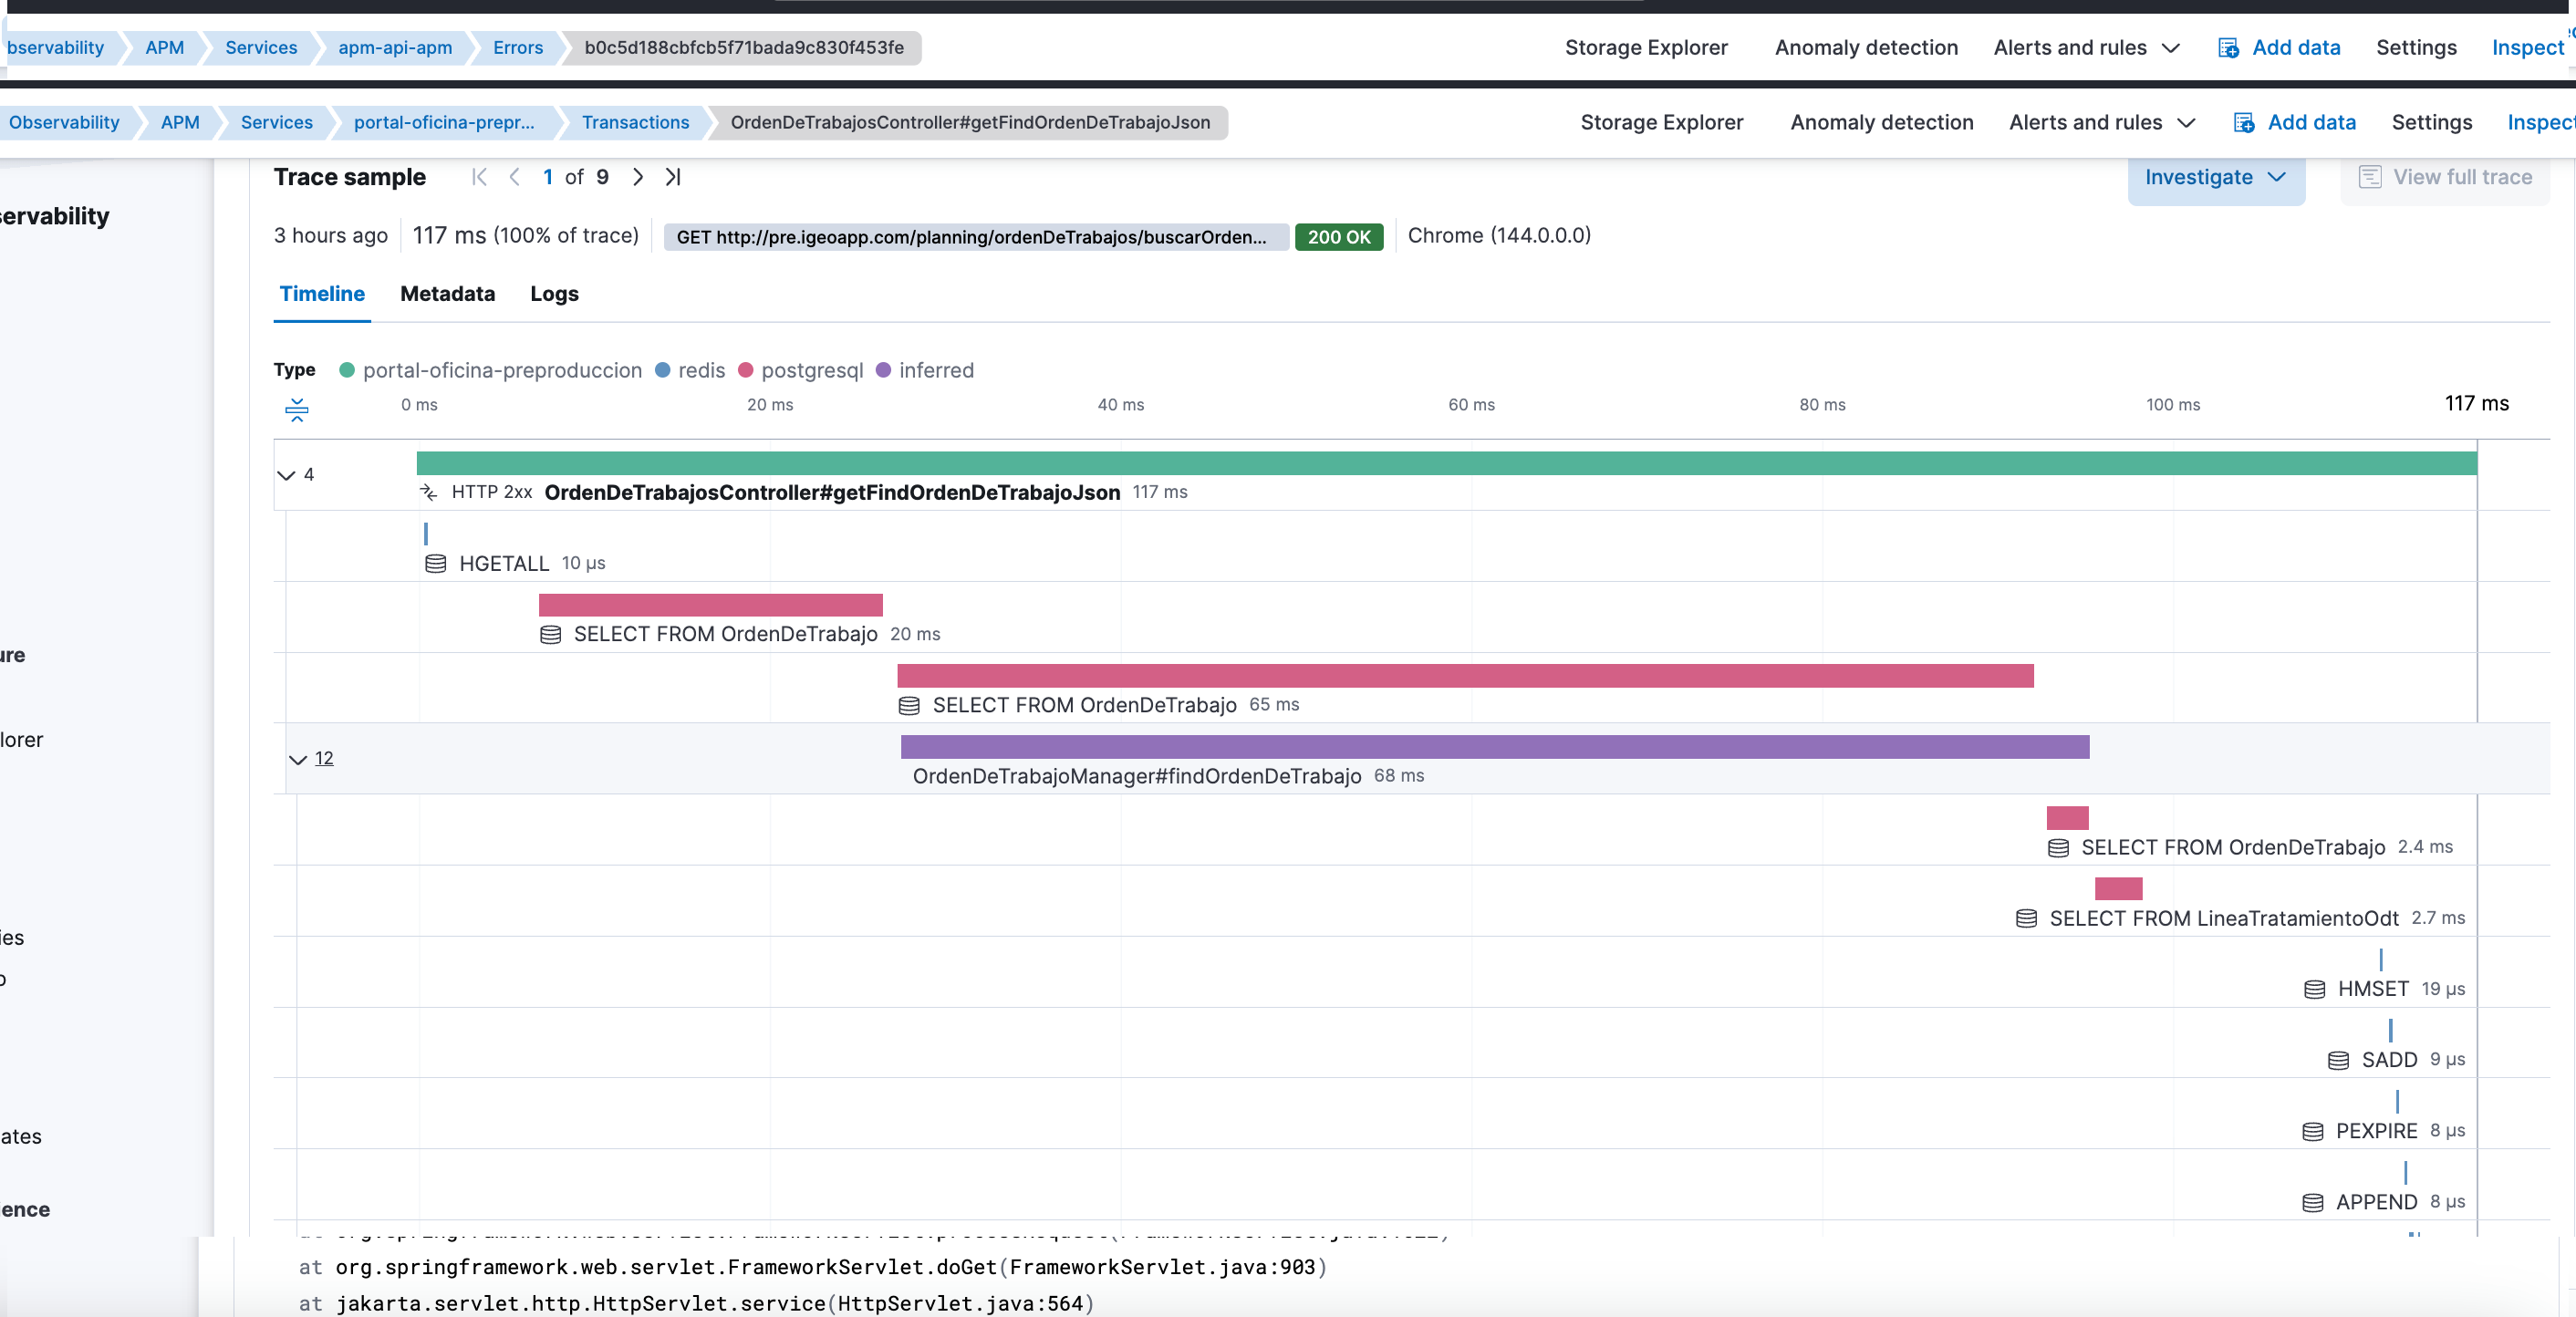
A better balance: inferred spans via profiling
Looking for a more reasonable alternative, I enabled inferred spans through profiling:
- name: ELASTIC_APM_PROFILING_INFERRED_SPANS_ENABLED
  value: "true"

- name: ELASTIC_APM_PROFILING_INFERRED_SPANS_MIN_DURATION
  value: "10ms"

- name: ELASTIC_APM_PROFILING_INFERRED_SPANS_SAMPLING_INTERVAL
  value: "50ms"
There was a clear shift here:
- Traces started showing much more internal detail.
- The actual path of the request was easier to understand.
- Without the cost or verbosity of TRACE_METHODS.
APM started being truly useful.
But errors still didn’t appear.
The focus mistake
At that point it was clear that:
- The agent worked.
- Instrumentation worked.
- Traces were being generated correctly.
The problem wasn’t in how data was captured, but in what happened to it after.
The real culprit: templates and ILM overriding APM
The real cause wasn’t in APM, but in log management.
There was a generic template for logs-*-* with higher priority than APM-specific templates.
This meant that for data streams like logs-apm.error-*, the generic template would win instead of what Fleet and APM expect.
Also, ILM operations were being applied indiscriminately to all data streams under logs-*, including APM’s, which have:
- Specific pipelines.
- Concrete mappings.
- Their own lifecycle policies.
The effect was silent but devastating:
- Transactions kept appearing.
- Traces remained visible.
- But errors and stacktraces were degraded or directly invisible.
Why APM seemed “empty” when filtering
The APM UI depends critically on fields like:
service.nameservice.environment
When APM templates were being overridden:
- These fields stopped behaving as APM expects.
- They weren’t aggregatable the right way.
- Filters by service or environment returned nothing.
From Kibana, the feeling was clear:
No errors.
In reality:
Errors existed, but APM couldn’t represent them correctly.
Why this problem is so hard to detect
Elastic doesn’t raise alerts for this. There are no obvious errors. No clear messages in the UI.
APM simply stops showing part of the information.
And that’s the most dangerous part:
- You think the problem is the agent.
- You adjust instrumentation.
- You change sampling.
- You add profiling.
When the real problem is in the data’s lifecycle and templates.
The real lesson
This case left several important lessons:
- APM can work partially and still seem “correct”.
- Seeing transactions doesn’t guarantee seeing errors.
- Adding more instrumentation can improve detail, but doesn’t fix ingestion or lifecycle problems.
- APM’s templates and ILM policies aren’t interchangeable with generic log ones.
And the most important:
In observability, it’s not enough for data to arrive. It has to arrive in the exact shape the tool expects.
Closing
Elastic APM was doing its job from the first moment. The errors existed too.
The problem was less visible and more dangerous: generic log configuration silently degrading APM.
Sometimes the problem isn’t that data isn’t generated, but that it’s processed correctly.
If you’re operating Elastic and encounter similar APM or observability issues, you can contact me.